
-
Posts
102 -
Joined
-
Last visited
Everything posted by Helos Bonos
-
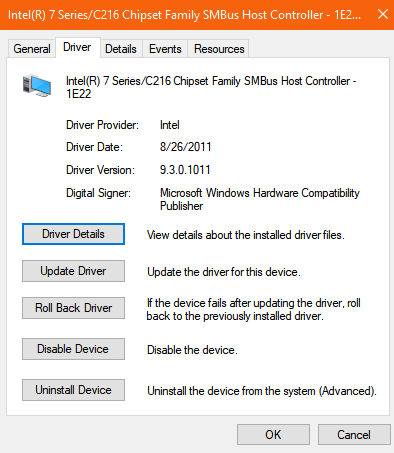
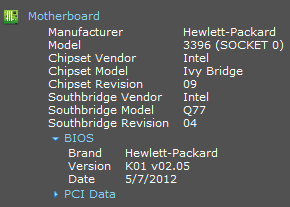
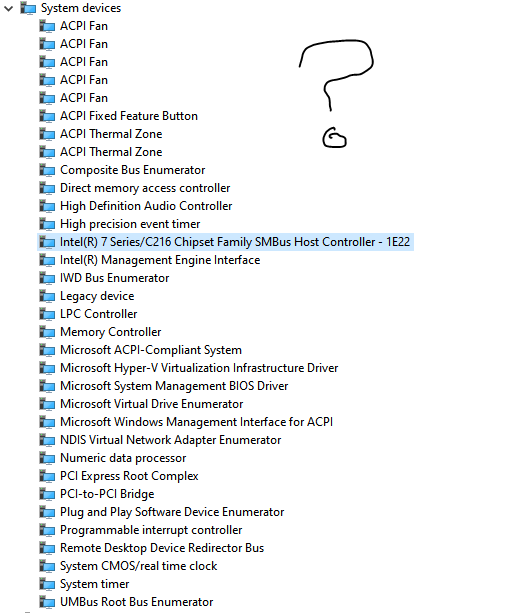
@msmcleod How can I find out which motherboard driver I currently have before I do that?
-

Prochannel and Gain Not Affecting Track Sound
Helos Bonos replied to Helos Bonos's topic in Cakewalk by BandLab
That what I'm afraid of! I can't afford to lose all those tuning edits. I guess I'll have to duplicate a guinea pig track and test it. -
Prochannel and Gain Not Affecting Track Sound
Helos Bonos replied to Helos Bonos's topic in Cakewalk by BandLab
So if I freeze the track with the Melodyne edits, will I be able to copy and paste the clips with the Melodyne tuning or do I have to bounce it first? -
Prochannel and Gain Not Affecting Track Sound
Helos Bonos replied to Helos Bonos's topic in Cakewalk by BandLab
So, I think you're right. I gridded the vocal clips before Melodyning. That's probably why it wouldn't show up as a region effect. I tried it on some other vocals that I did not edit and was able to add the region effect. DARN! Now I'm stuck with it this way. I already tuned the first chorus. My intention was to take that chorus and copy/paste to other parts of the song. But with Melodyne on the whole track, I guess I'll have to bounce it first. -
Prochannel and Gain Not Affecting Track Sound
Helos Bonos replied to Helos Bonos's topic in Cakewalk by BandLab
How do I do this? I'm sure I would have installed the VST3 version when installing Melo. Should I reinstall? -
@Larry Jones No, I mean just select the clip that is behind the one in front of it. I know if I drag across, it will select all and I can bounce to a clip which. I had to do that because I didn't know how to switch back and forth between the two clips. @John Vere I'm not much of a pianist thus heavy editing will be needed. But you reminded me of another question I had about CbB. Is it possible to punch in without having an end mark? I wanted to just punch in a place and play to the end of the song but I was frced to create an end point. I don't think I had this problem in other DAWs and found it to be yet another CbB annoyance. I'll have to try that @mark skinner. @David Baay you have some valid points. I would keep drums parts on separate tracks. But is it possible to send multiple MIDI tracks to one instrument like an Aux?
-
@kzmaier I did do that. I just didn't expect I would need to. I figured it would show up in the same clip. @mark skinner How do you select a clip that is behind another clip?
-
So here I am trying to record two separate MIDI parts on ONE MIDI clip in multiple takes. After I finished the second part, I see only my new notes showing but I hear both. SILLY STUPID ME!!! I thought they were going to both be on the same MIDI clip BAHAHAHAHAHAHAHAAAAAA I guess not. ??
-
Prochannel and Gain Not Affecting Track Sound
Helos Bonos replied to Helos Bonos's topic in Cakewalk by BandLab
@scook I guess it makes sense now. @lapasoa Meaning when I raise or lower the fader, I can hear the volume change. @msmcleod Thanks for that. That's what I tried to begin with but all the options in the context menu were greyed out so I had to put Melo on as a track effect. Sometimes when I go back to listen to my edits, I hear things that I missed or want to fix so I never want to commit to rendering the edits. Is it better to freeze the track when done editing or should I render to a new track and archive the original track in case I need to fix something? Or it is six of one, half dozen of the other? -
Prochannel and Gain Not Affecting Track Sound
Helos Bonos replied to Helos Bonos's topic in Cakewalk by BandLab
I have Melodyne on the track itself. I couldn't figure out how to put in on as a region effect but thinking back, I could have put Melodyne on each clip. But would that be less efficient on my CPU? I didn't put Prochannel anywhere other than it's default location on the track. -
New session, new issue. I have a vocal track with Melodyne on it. I'm trying to raise the level. Fader moves are audible. Gain all the way up or down not audible. I make drastic changes in EQ, not audible. Prochannel is on. But when I disable Melodyne, then I can hear the changes. Why is Melodyne affecting my track like this?
-
distorted vocals track but why?
Helos Bonos replied to RICHARD HUTCHINS's topic in Cakewalk by BandLab
@scook Couldn't he just right click on the track header and choose "Convert to Mono"? Or will that combine the two channels outputting a lower signal composite of both channels? -
distorted vocals track but why?
Helos Bonos replied to RICHARD HUTCHINS's topic in Cakewalk by BandLab
Oh, I forgot to mention. If you have a meter or a clipping light on your interface, when you are singing into the mic, make sure the meter or light does not hit red. You want to keep it just below yellow. Try to stay in the green zone (or light) and you should be good. Red means clipping. Yellow means getting close to clipping. -
distorted vocals track but why?
Helos Bonos replied to RICHARD HUTCHINS's topic in Cakewalk by BandLab
I think you are recording too hot. Wherever you see the bottom of the waveform touch the middle horizontal line, that is clipping. When I said post a clip, I meant audio clip but this is ok. I think you need to lower your input gain on the Scarlett low enough were the waveform is not touching the middle line (and you don't hear clipping) and then compensate by turning up the output of your interface and or your monitors. You also might have to lower the levels of your other tracks for everything to be more balanced. -
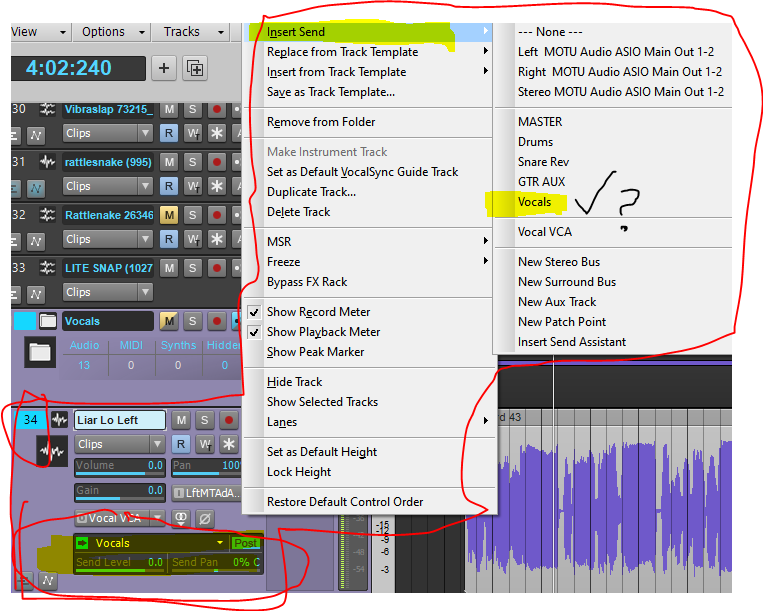
No, that's different. When you right click to add any of the above mentioned tracks, it doesn't show existing tracks. But when you right click on Insert Send, it shows you a list of existing busses, auxes, and patch points. It shows the check mark when you click on the send itself! What's the point of that? I know it's there, I just clicked on it! Not that it hurts but why not have the checkmarks on the insert send list of existing sends? It's an extra step to show the inspector and make sure it's on the right track.
-
@Klaus Upon further investigation, just as you said, there is no checkmark and if I do click it again, it indeed adds an additional send. Their is, however, a checkmark when I click the send and choose to reassign it. Which is kind of *****. I'm clicking on the send itself so yeah, I KNOW that that is the current send. Don't really need a checkmark there, but thanks anyway. I think it would make better sense to have the checkmark when right clicking on the track so we don't have to expand it to see if there are sends on the track. Maybe they have their reason or just didn't think of it! Or maybe this is another evidence that CbB is not. That. Intuitive.
-
New session, new issue. Shouldn't there be a checkmark on the dropdown since I have a send on this track? As you can see, the send does exist on the track but when I right click to see it from the context menu, it doens't have a checkmark next to the send. It did it before. Is this a bug or am I missing something?
-
I took you guys' advice and ran LatencyMon and I'm sure it will reveal the culprit of my woes and now yalls go radio silent on me? We're so close @MediaGary and @bitflipper!!! Please help!
-
distorted vocals track but why?
Helos Bonos replied to RICHARD HUTCHINS's topic in Cakewalk by BandLab
Did you try bypassing all plugins? Can you post a clip of the distorted audio? -
Alt + Scroll Button SERIOUSLY Impeding My Workflow
Helos Bonos replied to Helos Bonos's topic in Feedback Loop
I just discovered you can adjust the zoom amount for smoother zooming with the scroll wheel but requires more spinning of the wheel: Track menu item>Options>Mouse Wheel Zoom Options...>Zoom Factor>Horizontal But it doesn't fix the PRV zoom. Apparently there's no connection between the two operations. -
I am the OP on the subject (as of late at least), as you may already know. This doesn't solve anything but just to put it out there, I have used another DAW called Waveform 10 and the timeline zoom vs the PRV zooms are actually both completely different operations (which is even more frustrating than different zoom levels for each). So maybe it's just inherent in DAWs that these two seemingly related operations are completely separate.
-
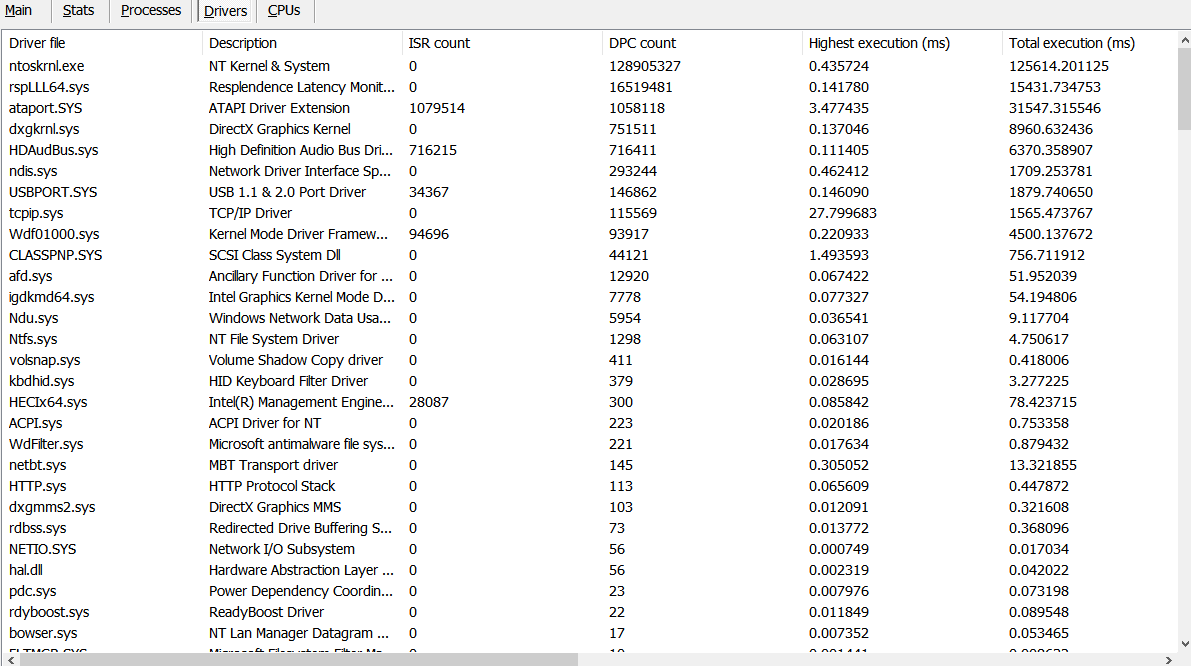
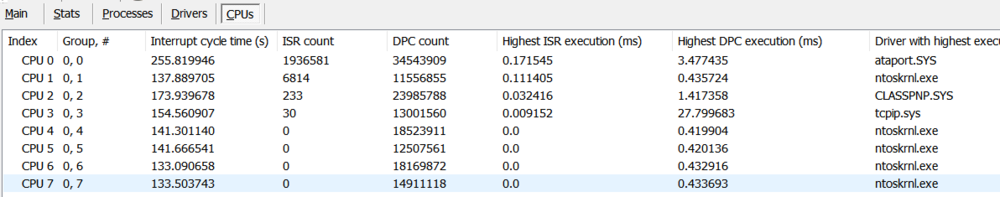
@MediaGary @bitflipper Thank you guys for reminding me about LatencyMon. I ran it and I'm sure it will point me to the direction to solve all my problems. Problem is, I'm not that great with computer stuff so I don't quite understand everything in the results. I'll paste the text here and hopefully you can decipher it for me. FYI, I was not doing music during this monitor. Not sure how big a difference that makes. If you want I can do it again while recording. But I think this shows that I have an existing problem recording or not since the interrupt and DPC routine meters are maxed out to the red. But maybe it's from running for almost 2 hours? Anyway, thanks. _________________________________________________________________________________________________________ CONCLUSION _________________________________________________________________________________________________________ Your system appears to be having trouble handling real-time audio and other tasks. You are likely to experience buffer underruns appearing as drop outs, clicks or pops. One or more DPC routines that belong to a driver running in your system appear to be executing for too long. At least one detected problem appears to be network related. In case you are using a WLAN adapter, try disabling it to get better results. One problem may be related to power management, disable CPU throttling settings in Control Panel and BIOS setup. Check for BIOS updates. LatencyMon has been analyzing your system for 1:37:27 (h:mm:ss) on all processors. _________________________________________________________________________________________________________ SYSTEM INFORMATION _________________________________________________________________________________________________________ Computer name: ROY-PC OS version: Windows 10 , 10.0, build: 18363 (x64) Hardware: HP Compaq Elite 8300 CMT, Hewlett-Packard, 3396 CPU: GenuineIntel Intel(R) Core(TM) i7-3770 CPU @ 3.40GHz Logical processors: 8 Processor groups: 1 RAM: 16258 MB total _________________________________________________________________________________________________________ CPU SPEED _________________________________________________________________________________________________________ Reported CPU speed: 3392 MHz Measured CPU speed: 10 MHz (approx.) Note: reported execution times may be calculated based on a fixed reported CPU speed. Disable variable speed settings like Intel Speed Step and AMD Cool N Quiet in the BIOS setup for more accurate results. WARNING: the CPU speed that was measured is only a fraction of the CPU speed reported. Your CPUs may be throttled back due to variable speed settings and thermal issues. It is suggested that you run a utility which reports your actual CPU frequency and temperature. _________________________________________________________________________________________________________ MEASURED INTERRUPT TO USER PROCESS LATENCIES _________________________________________________________________________________________________________ The interrupt to process latency reflects the measured interval that a usermode process needed to respond to a hardware request from the moment the interrupt service routine started execution. This includes the scheduling and execution of a DPC routine, the signaling of an event and the waking up of a usermode thread from an idle wait state in response to that event. Highest measured interrupt to process latency (µs): 48161.70 Average measured interrupt to process latency (µs): 4.266973 Highest measured interrupt to DPC latency (µs): 48141.30 Average measured interrupt to DPC latency (µs): 1.145050 _________________________________________________________________________________________________________ REPORTED ISRs _________________________________________________________________________________________________________ Interrupt service routines are routines installed by the OS and device drivers that execute in response to a hardware interrupt signal. Highest ISR routine execution time (µs): 171.545401 Driver with highest ISR routine execution time: ataport.SYS - ATAPI Driver Extension, Microsoft Corporation Highest reported total ISR routine time (%): 0.013799 Driver with highest ISR total time: ataport.SYS - ATAPI Driver Extension, Microsoft Corporation Total time spent in ISRs (%) 0.023949 ISR count (execution time <250 µs): 1747633 ISR count (execution time 250-500 µs): 0 ISR count (execution time 500-999 µs): 0 ISR count (execution time 1000-1999 µs): 0 ISR count (execution time 2000-3999 µs): 0 ISR count (execution time >=4000 µs): 0 _________________________________________________________________________________________________________ REPORTED DPCs _________________________________________________________________________________________________________ DPC routines are part of the interrupt servicing dispatch mechanism and disable the possibility for a process to utilize the CPU while it is interrupted until the DPC has finished execution. Highest DPC routine execution time (µs): 27799.683373 Driver with highest DPC routine execution time: tcpip.sys - TCP/IP Driver, Microsoft Corporation Highest reported total DPC routine time (%): 0.219153 Driver with highest DPC total execution time: ntoskrnl.exe - NT Kernel & System, Microsoft Corporation Total time spent in DPCs (%) 0.359287 DPC count (execution time <250 µs): 134956854 DPC count (execution time 250-500 µs): 0 DPC count (execution time 500-999 µs): 881 DPC count (execution time 1000-1999 µs): 12 DPC count (execution time 2000-3999 µs): 2 DPC count (execution time >=4000 µs): 0 _________________________________________________________________________________________________________ REPORTED HARD PAGEFAULTS _________________________________________________________________________________________________________ Hard pagefaults are events that get triggered by making use of virtual memory that is not resident in RAM but backed by a memory mapped file on disk. The process of resolving the hard pagefault requires reading in the memory from disk while the process is interrupted and blocked from execution. Process with highest pagefault count: none Total number of hard pagefaults 0 Hard pagefault count of hardest hit process: 0 Highest hard pagefault resolution time (µs): 0.0 Total time spent in hard pagefaults (%): 0.0 Number of processes hit: 0 _________________________________________________________________________________________________________ PER CPU DATA _________________________________________________________________________________________________________ CPU 0 Interrupt cycle time (s): 226.896236 CPU 0 ISR highest execution time (µs): 171.545401 CPU 0 ISR total execution time (s): 11.159355 CPU 0 ISR count: 1741371 CPU 0 DPC highest execution time (µs): 3409.998821 CPU 0 DPC total execution time (s): 65.697154 CPU 0 DPC count: 31090621 _________________________________________________________________________________________________________ CPU 1 Interrupt cycle time (s): 121.861007 CPU 1 ISR highest execution time (µs): 90.525649 CPU 1 ISR total execution time (s): 0.041368 CPU 1 ISR count: 5999 CPU 1 DPC highest execution time (µs): 435.723762 CPU 1 DPC total execution time (s): 10.734181 CPU 1 DPC count: 10730147 _________________________________________________________________________________________________________ CPU 2 Interrupt cycle time (s): 152.916420 CPU 2 ISR highest execution time (µs): 32.415979 CPU 2 ISR total execution time (s): 0.001424 CPU 2 ISR count: 233 CPU 2 DPC highest execution time (µs): 1417.358196 CPU 2 DPC total execution time (s): 21.144566 CPU 2 DPC count: 21806312 _________________________________________________________________________________________________________ CPU 3 Interrupt cycle time (s): 135.026555 CPU 3 ISR highest execution time (µs): 9.152123 CPU 3 ISR total execution time (s): 0.000148 CPU 3 ISR count: 30 CPU 3 DPC highest execution time (µs): 27799.683373 CPU 3 DPC total execution time (s): 12.141802 CPU 3 DPC count: 12096678 _________________________________________________________________________________________________________ CPU 4 Interrupt cycle time (s): 123.335584 CPU 4 ISR highest execution time (µs): 0.0 CPU 4 ISR total execution time (s): 0.0 CPU 4 ISR count: 0 CPU 4 DPC highest execution time (µs): 419.904481 CPU 4 DPC total execution time (s): 16.663639 CPU 4 DPC count: 16989204 _________________________________________________________________________________________________________ CPU 5 Interrupt cycle time (s): 122.607718 CPU 5 ISR highest execution time (µs): 0.0 CPU 5 ISR total execution time (s): 0.0 CPU 5 ISR count: 0 CPU 5 DPC highest execution time (µs): 420.136203 CPU 5 DPC total execution time (s): 11.833393 CPU 5 DPC count: 11667294 _________________________________________________________________________________________________________ CPU 6 Interrupt cycle time (s): 117.999810 CPU 6 ISR highest execution time (µs): 0.0 CPU 6 ISR total execution time (s): 0.0 CPU 6 ISR count: 0 CPU 6 DPC highest execution time (µs): 432.916274 CPU 6 DPC total execution time (s): 16.407517 CPU 6 DPC count: 16761656 _________________________________________________________________________________________________________ CPU 7 Interrupt cycle time (s): 117.095633 CPU 7 ISR highest execution time (µs): 0.0 CPU 7 ISR total execution time (s): 0.0 CPU 7 ISR count: 0 CPU 7 DPC highest execution time (µs): 433.693396 CPU 7 DPC total execution time (s): 13.438076 CPU 7 DPC count: 13815838 _________________________________________________________________________________________________________

-
Alt + Scroll Button SERIOUSLY Impeding My Workflow
Helos Bonos replied to Helos Bonos's topic in Feedback Loop
@winkpain Well, you just solved that problem! But you know, why wouldn't CbB just give you a PRACTICAL color combination by default and let you muck it up if you choose rather than giving it to you mucked up so you have to fix it??? I notice a lot of defaults are like this and this is not only a CbB issue. Reaper is guiltily of this as well. -
Constant Audio Dropouts and HUGE Latency
Helos Bonos replied to Helos Bonos's topic in Cakewalk by BandLab
So I did finally get the legacy driver installed but my issues remain. Latency (even when buffer size is at 64), audio dropouts, horrible random glitch noises on my audio clips that seem to be embedded in the clip (I move the clip around on the timeline and turn effects on and off).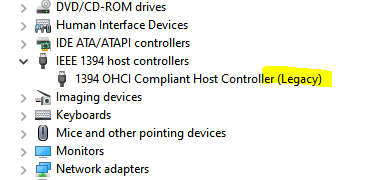

-
@Jon White Good idea but na.